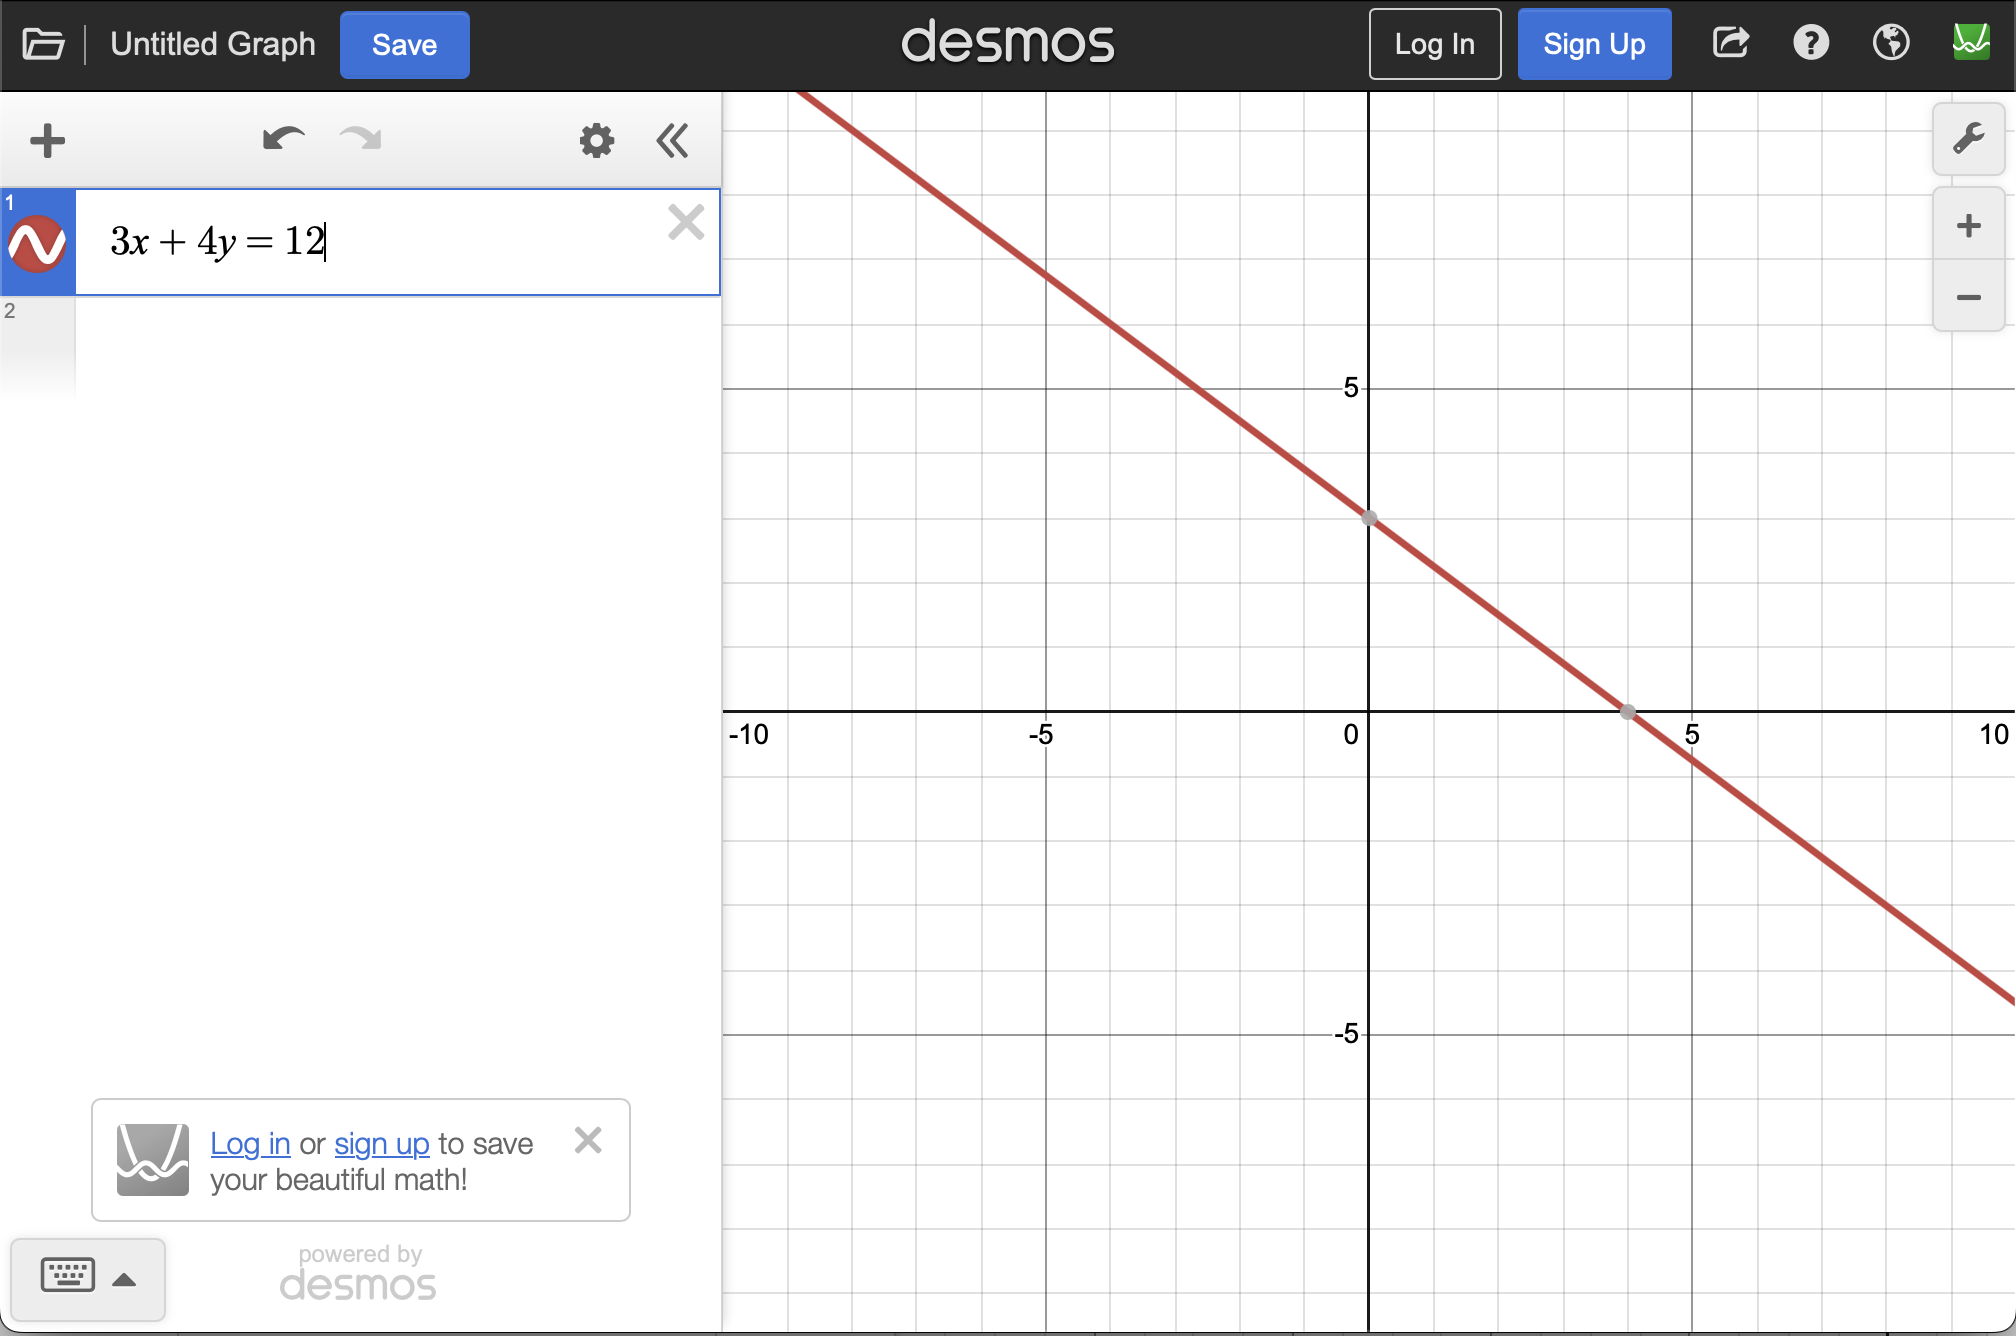
Software can help with the plotting of lines, planes and linear inequalities. In Subsection 1.1.1, the equation \(3x+4y=12\) and linearly inequality \(3x+4y \leq 12\) was plotted.
Subsection1.2.2Plotting Inequalities and Feasible Sets
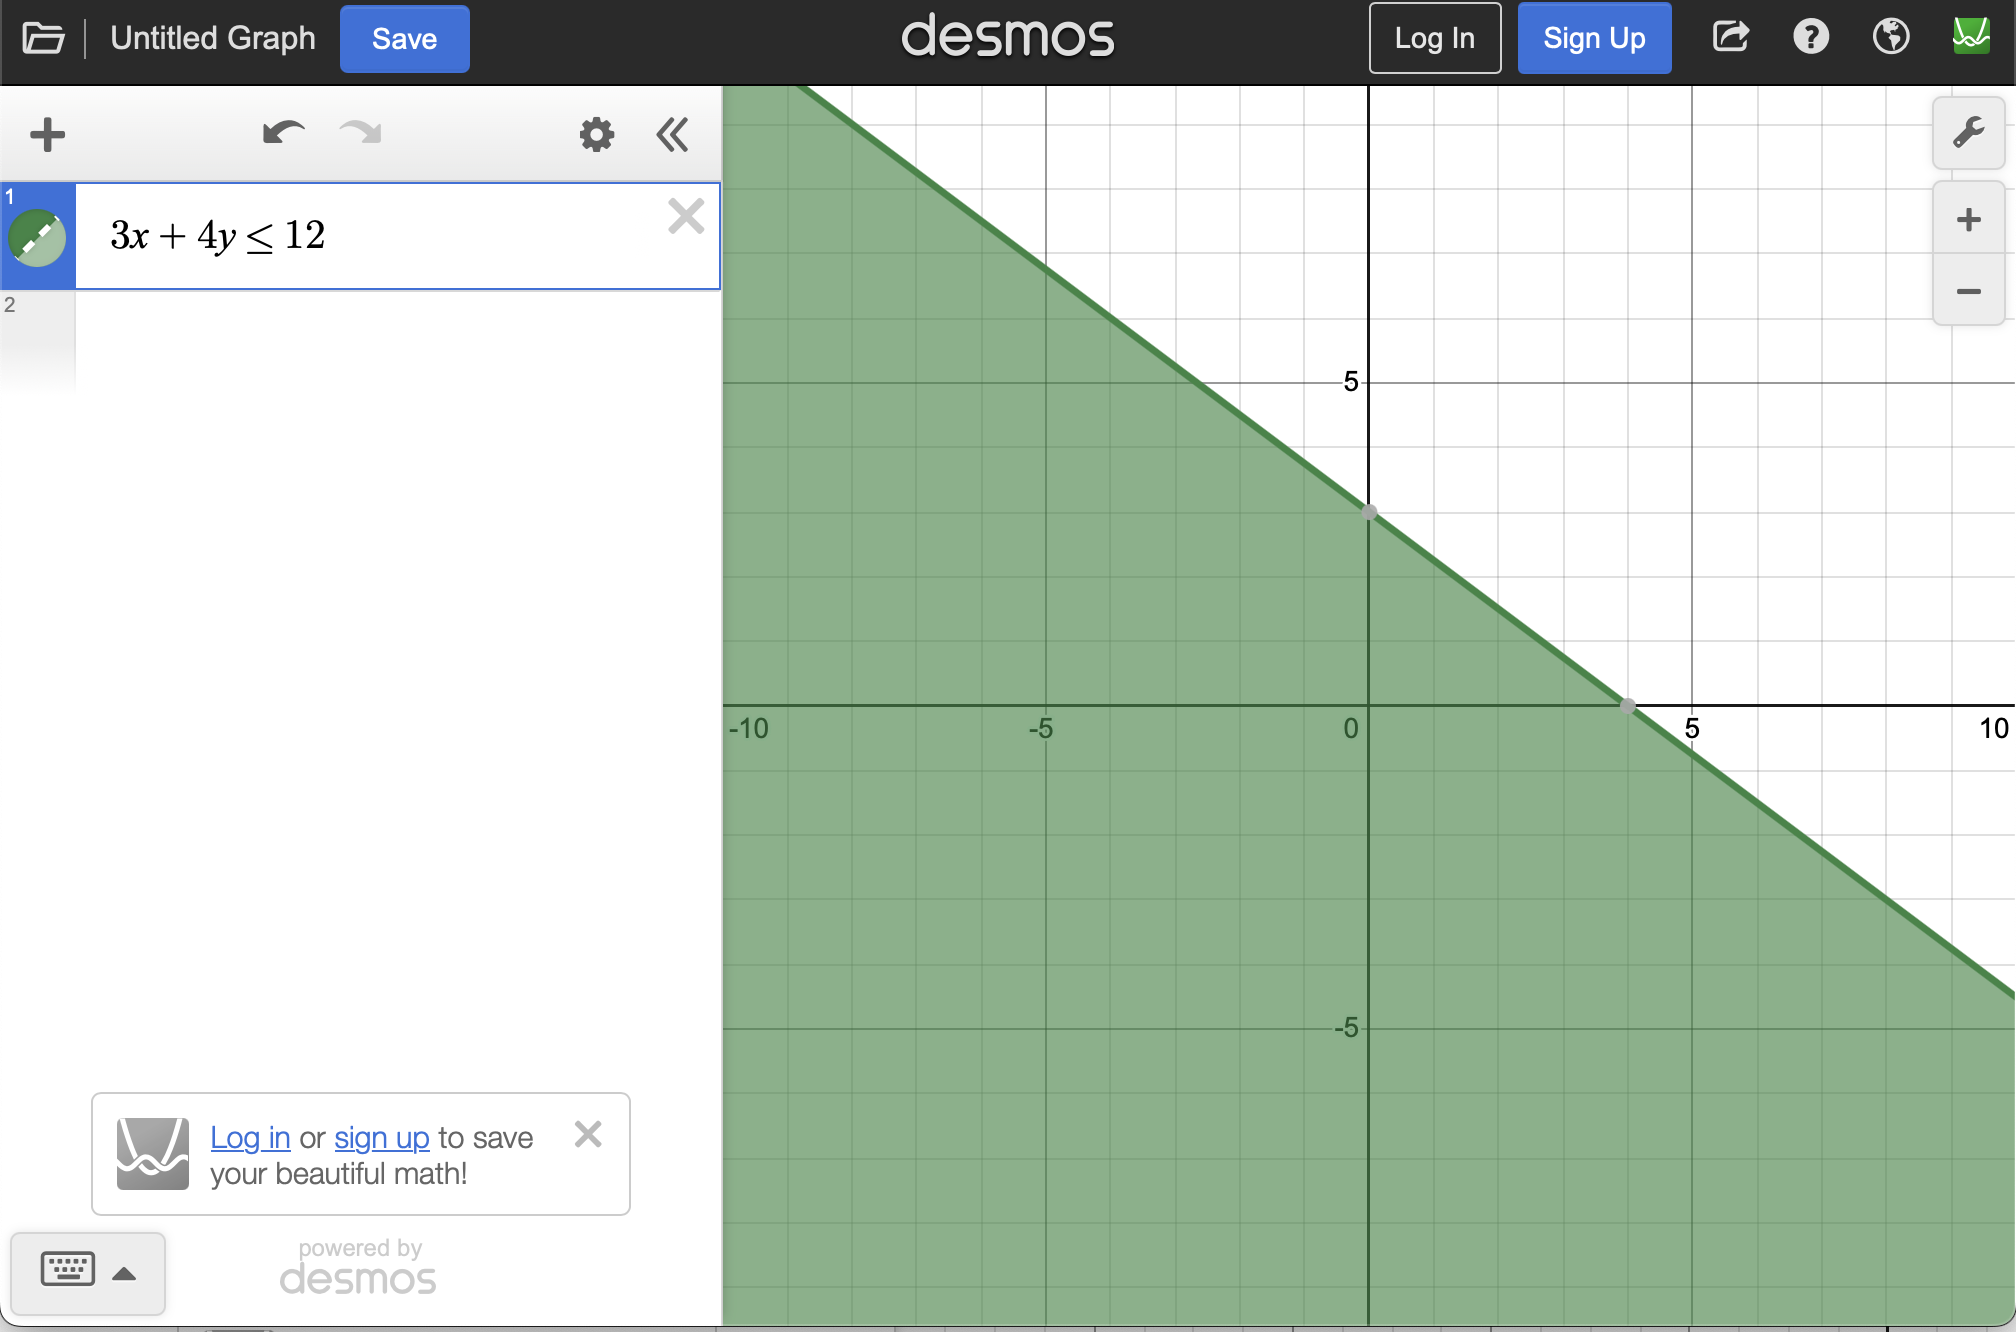
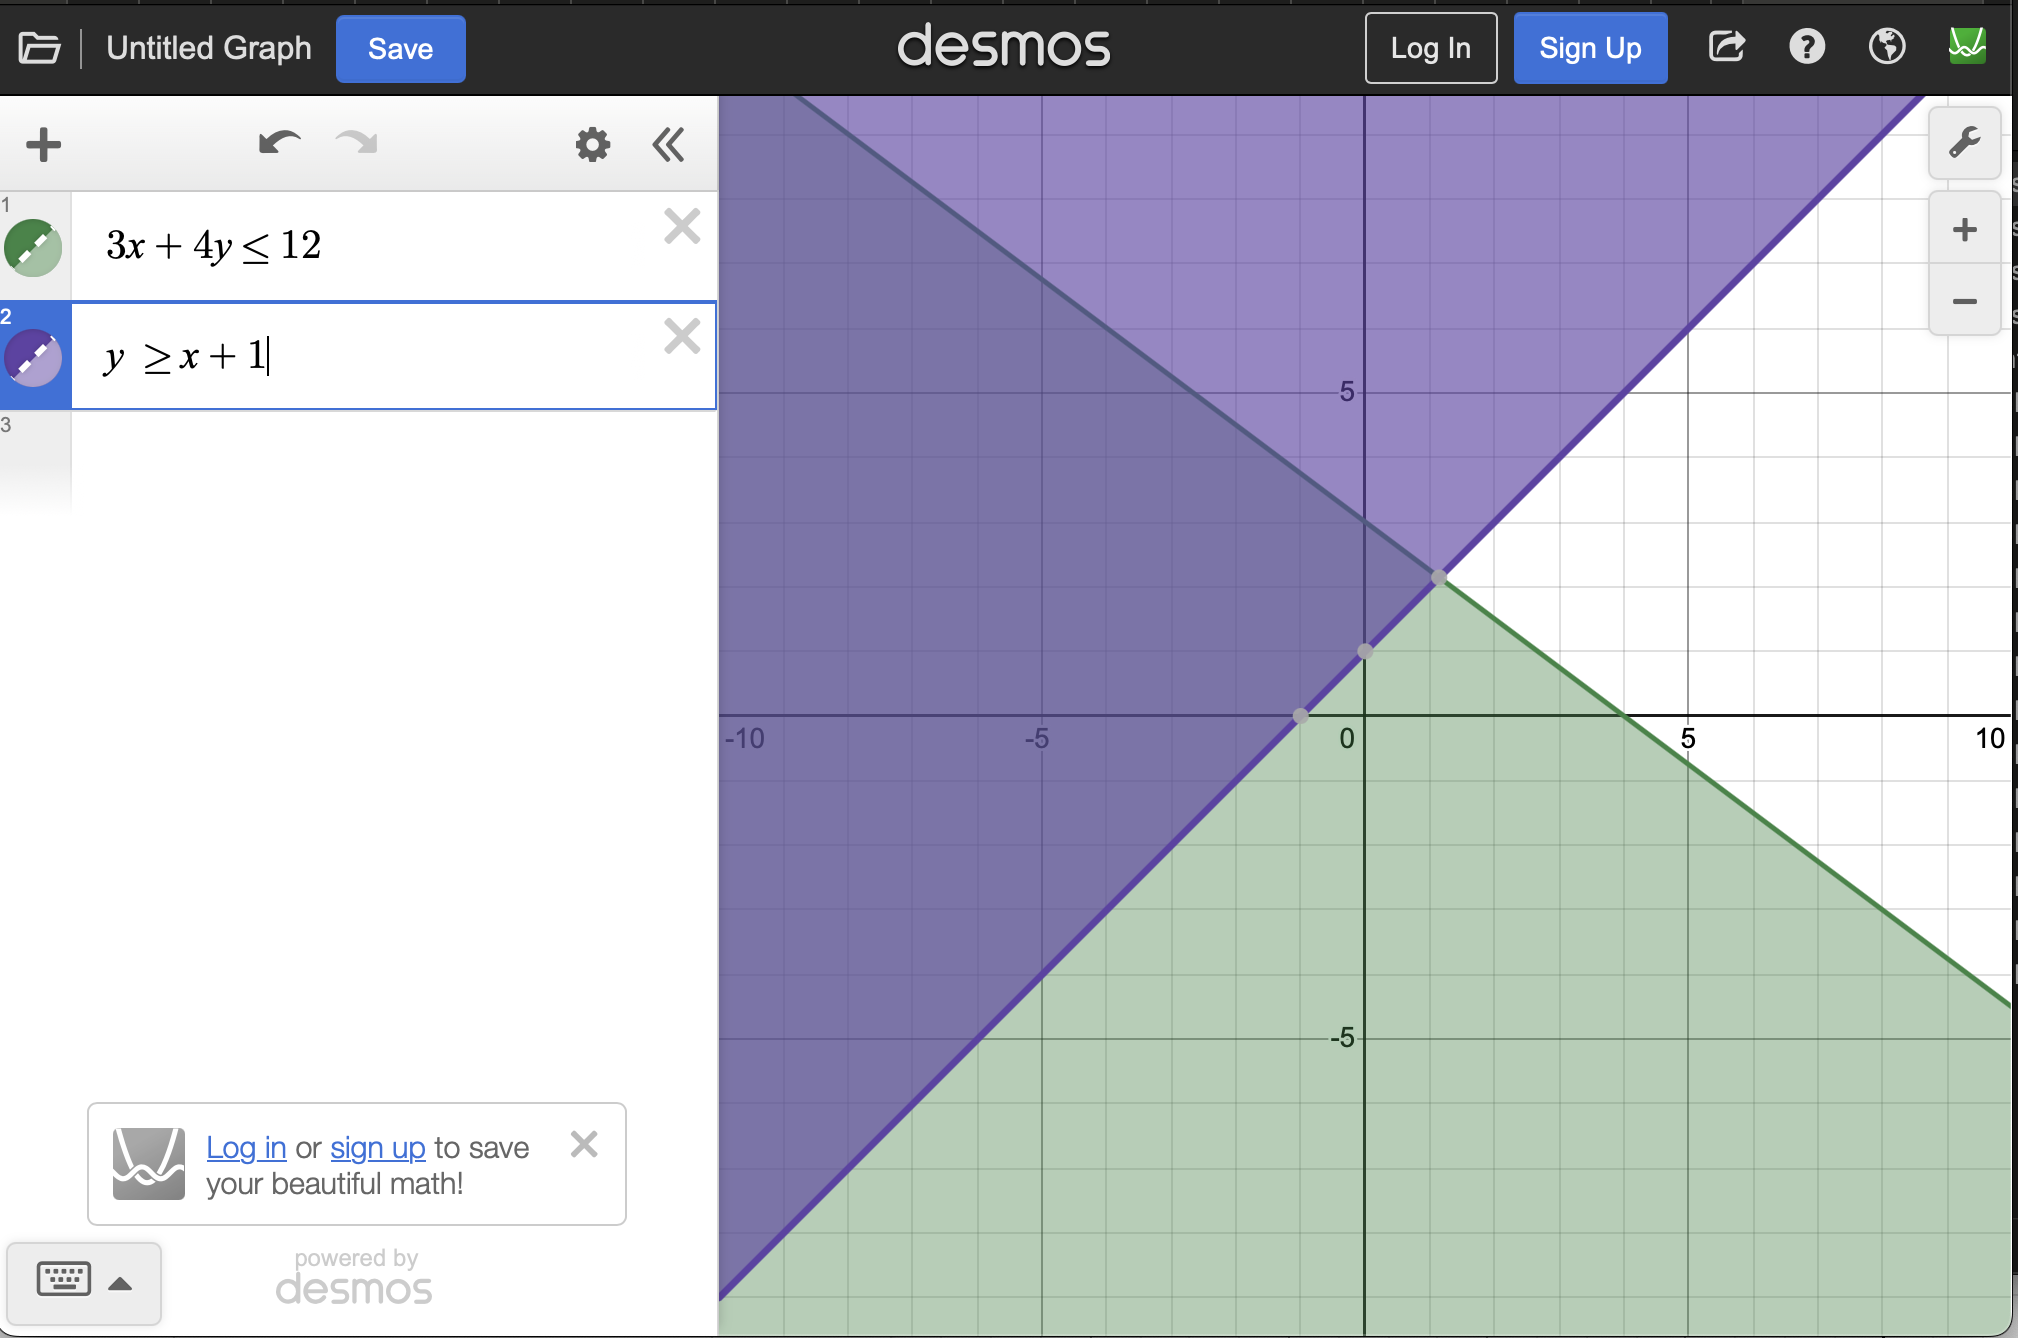
Inequalities can also be plotted. Return to desmos and remove all equations by hitting the X on the right side of each entry box. Now add 3x+4y ≤ 12 where Demos will automatically convert <= to ≤. The resulting plot will be
Note that the colors of all the plots may be different. Desmos usually cycles through the colors in a specific manner, but this may differ as you enter equations.
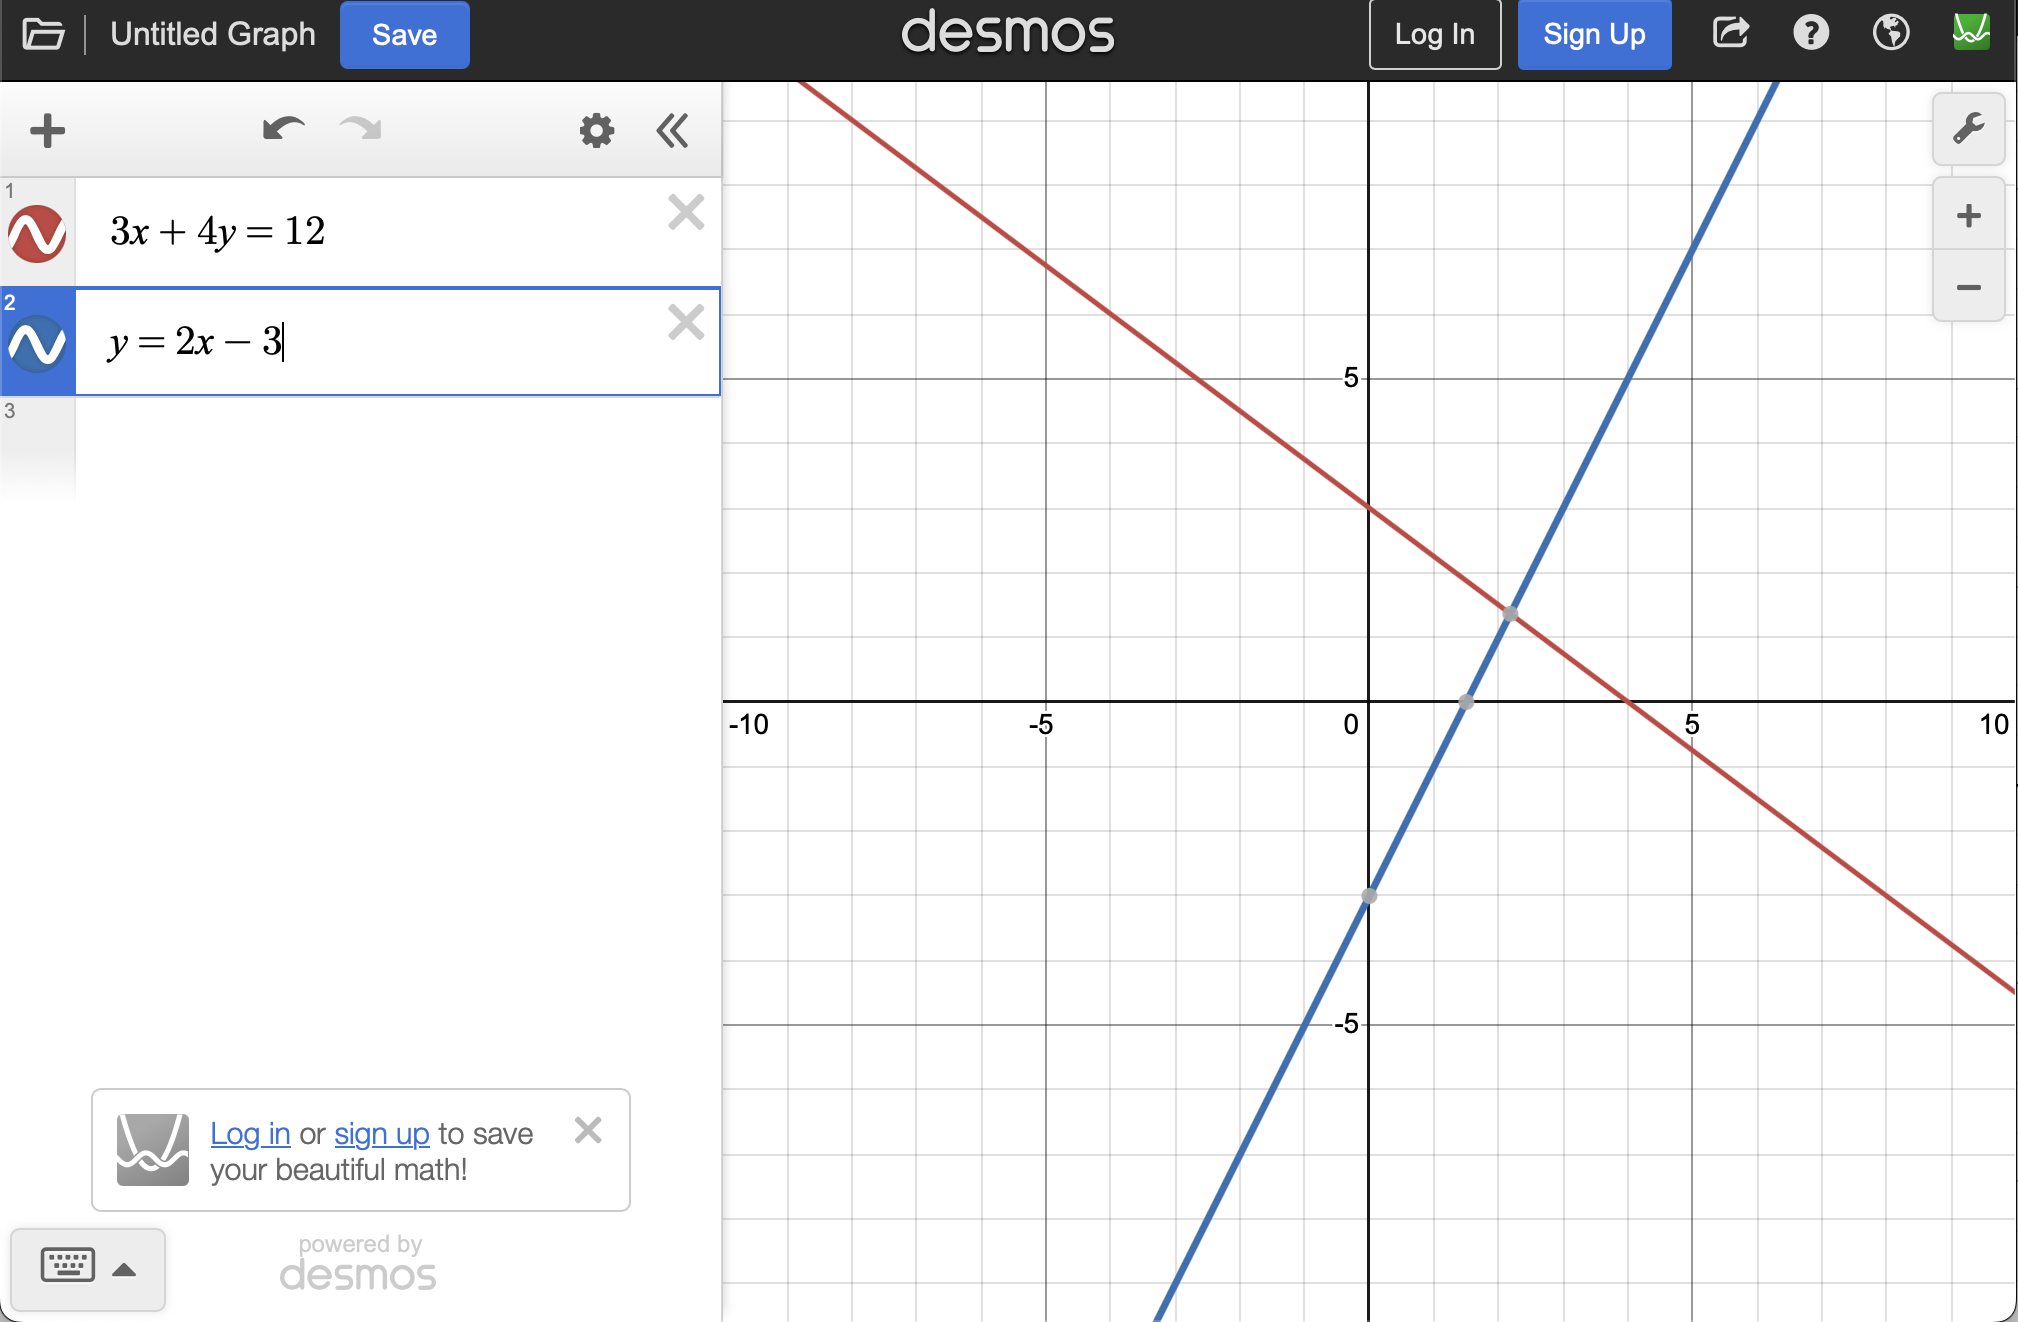
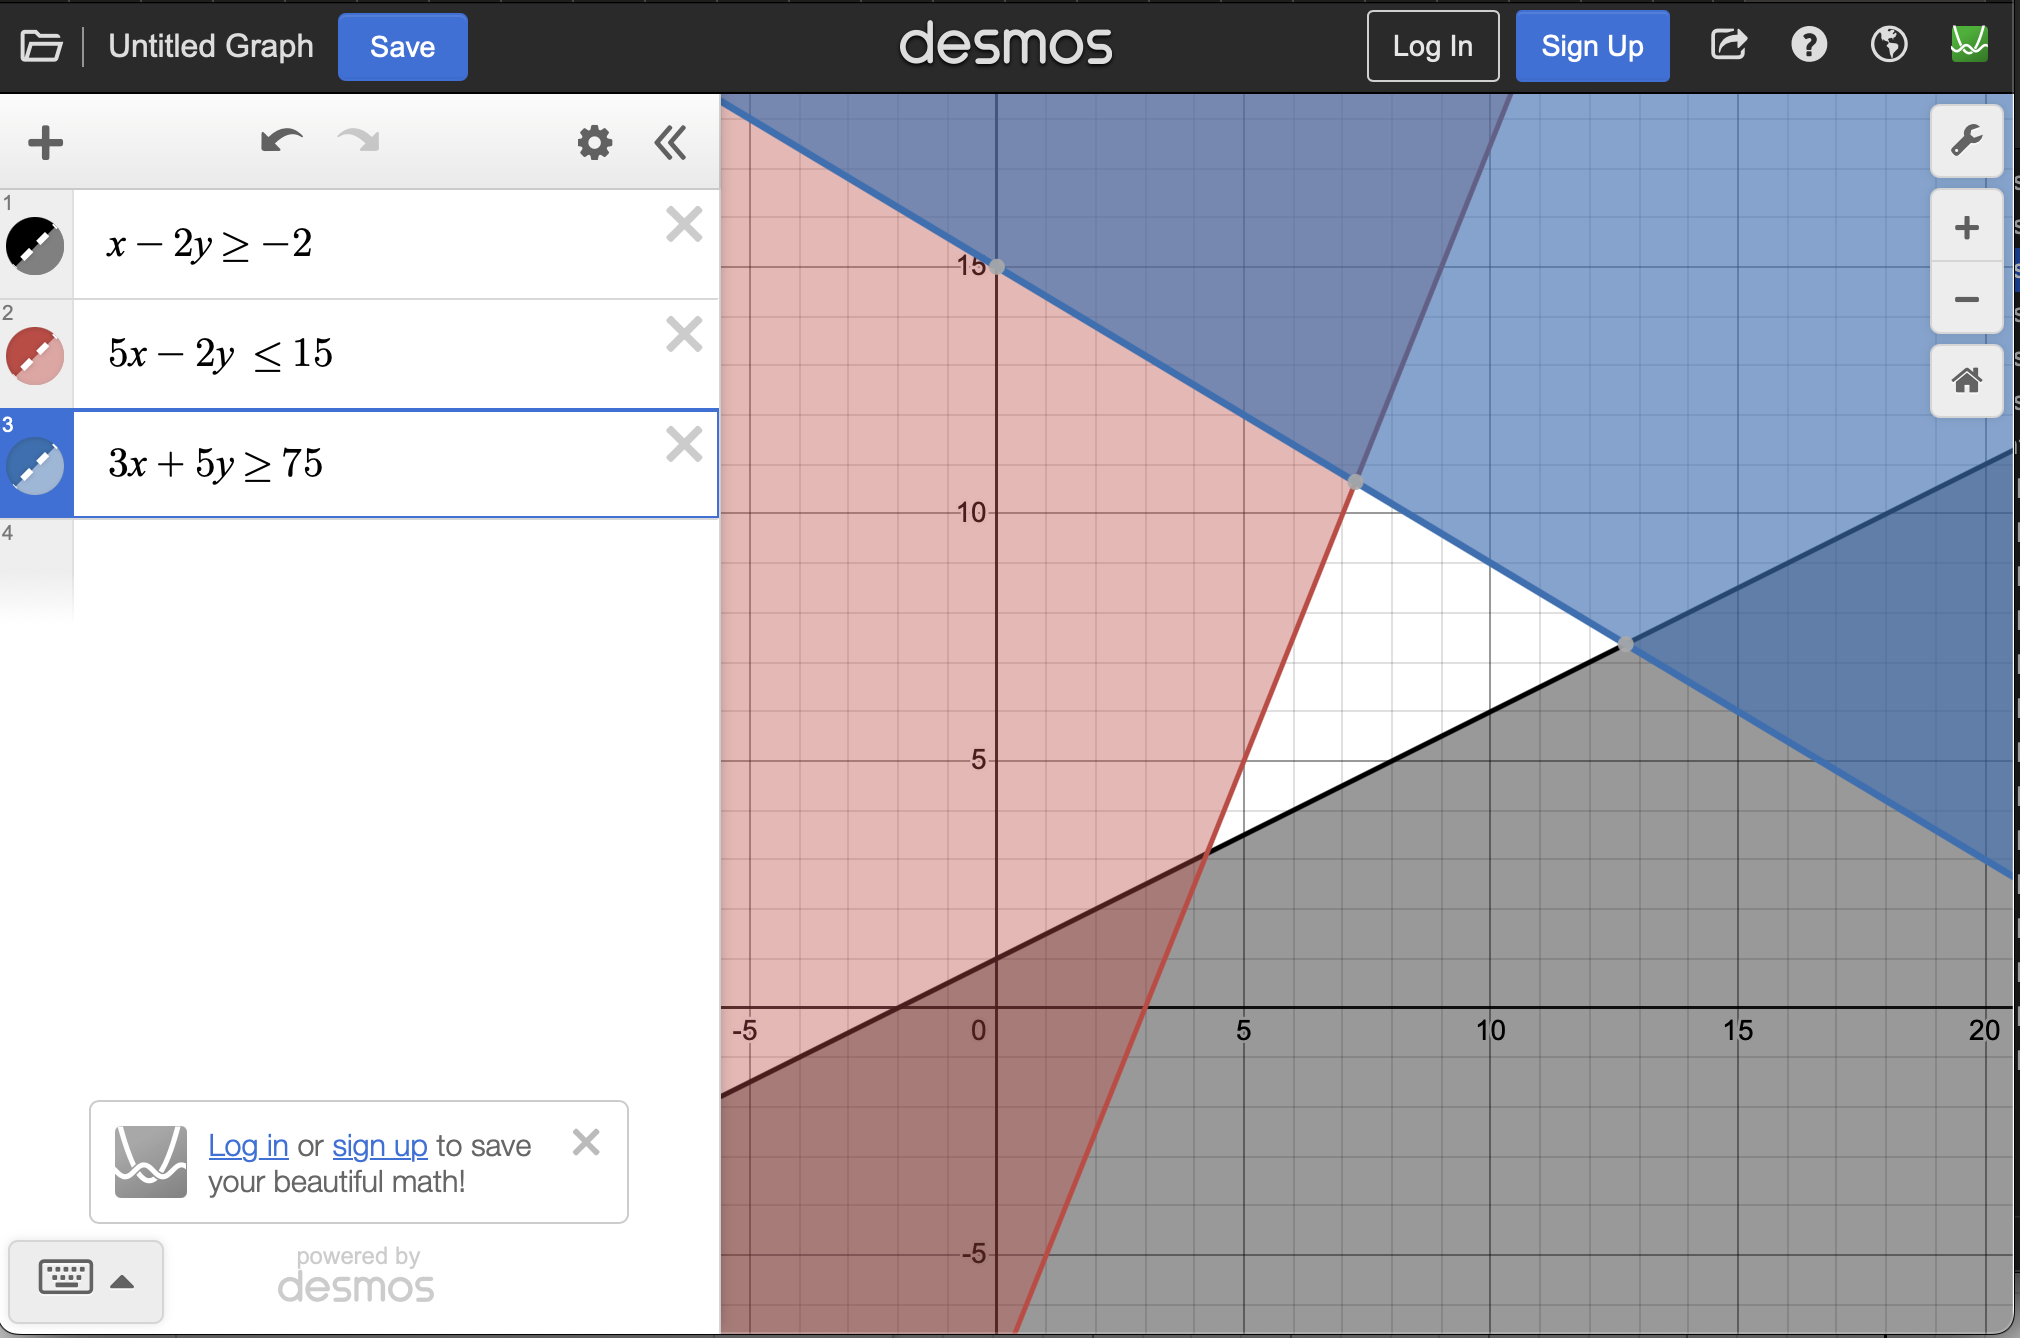
With only two inequalities, visually the overlap (the set of points that satisfy both inequalities) is reasonably easy to see, however, as these grow, it can be more difficulty to see. One way is to plot the opposite inequality and then area of the plane with no coloring would be the resultant set.
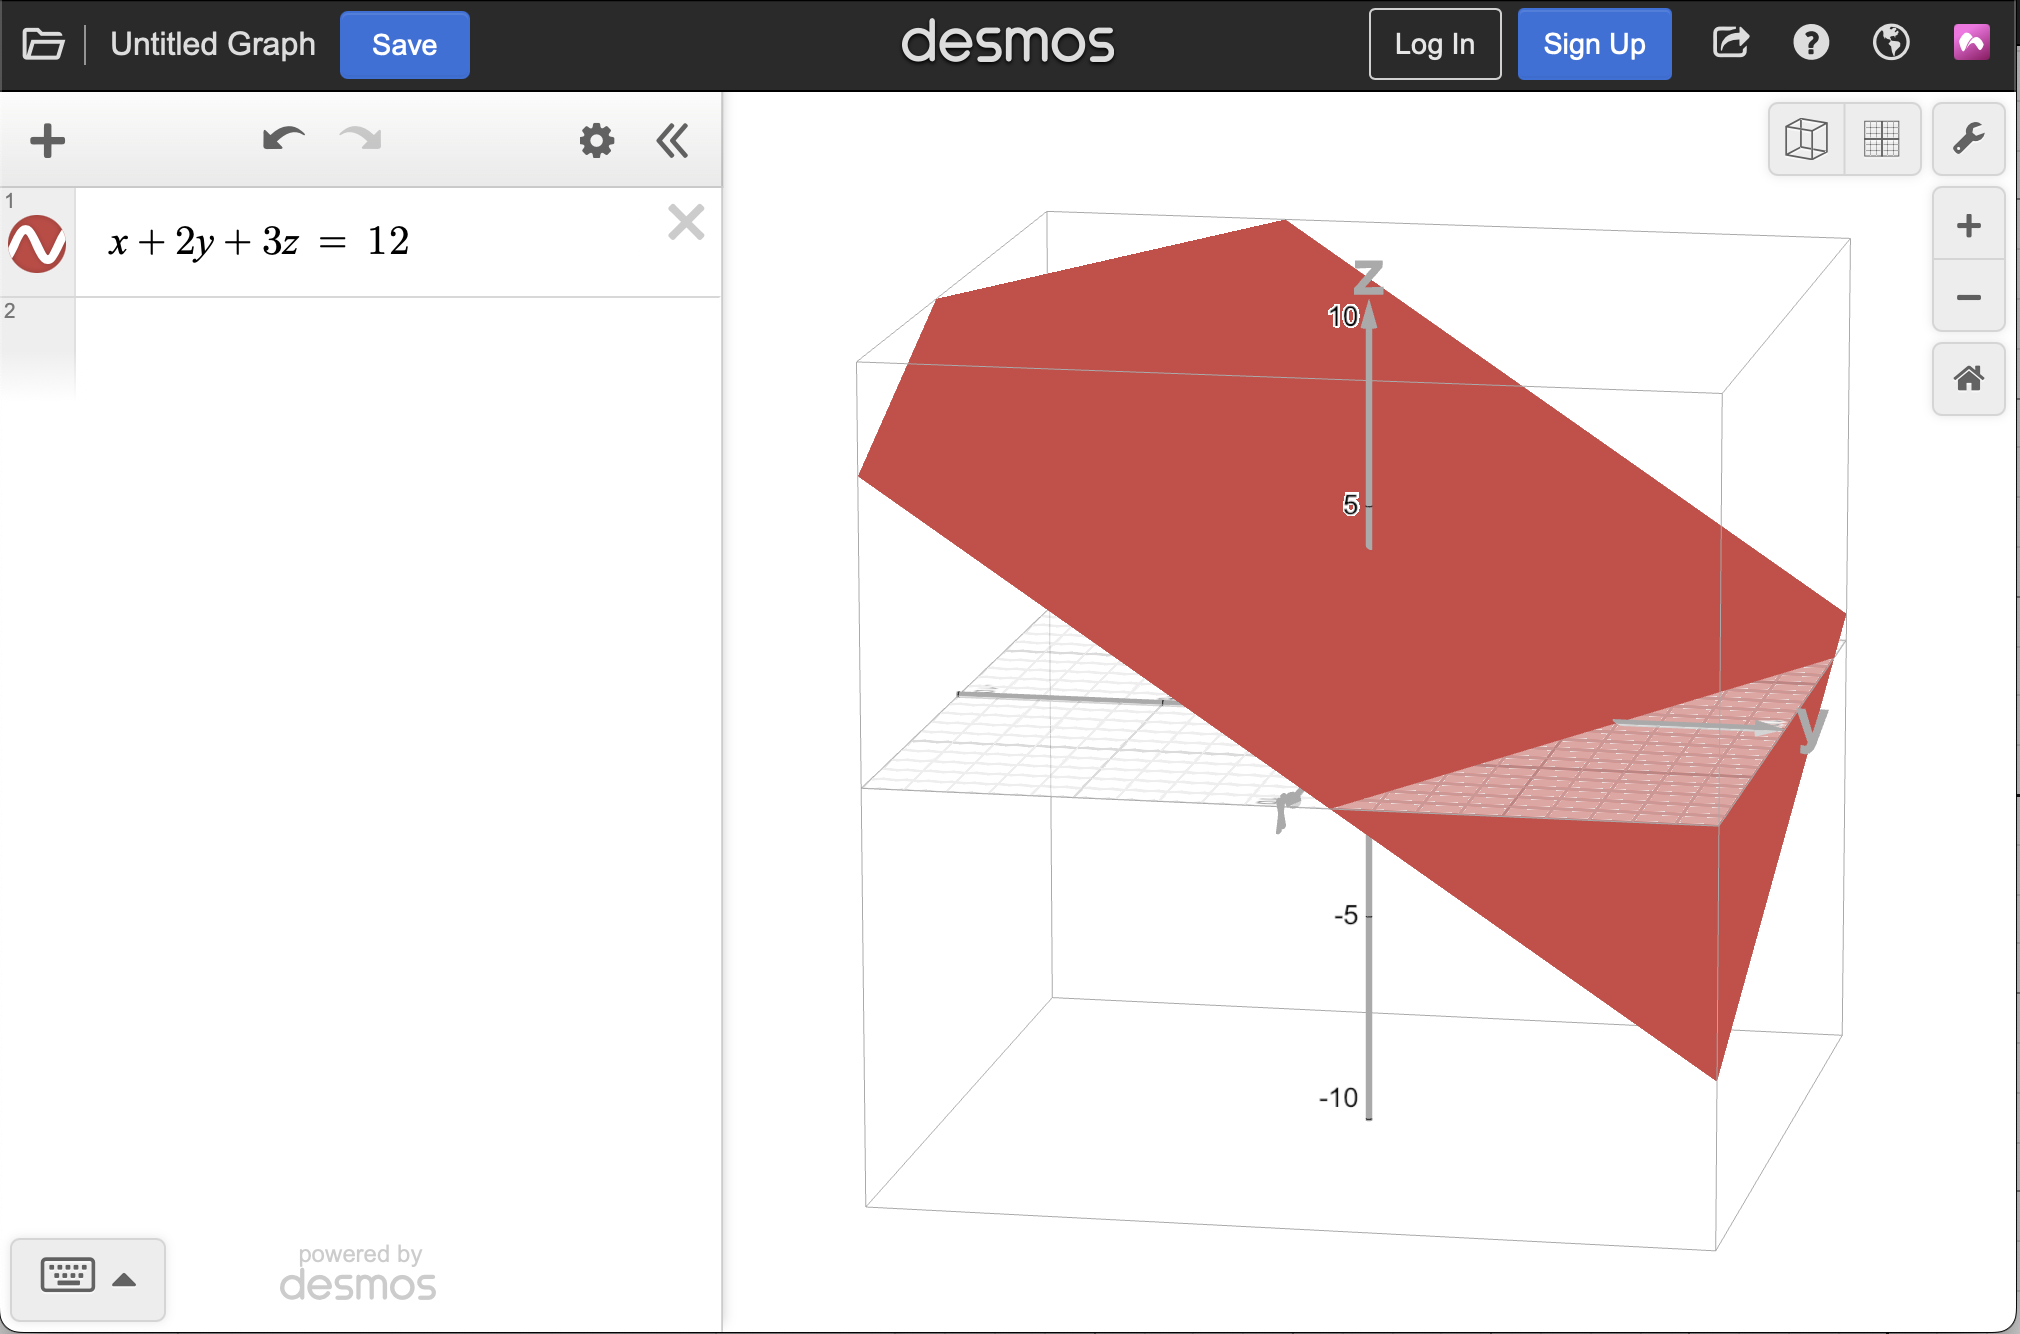
As we saw in Section 1.1, planes are another example of linear functions that we will encounter in this text. Desmos also has a 3D graphing calculator. Open up the webpage and it will look like the regular graphing calculator, however the default axes are in \(\mathbb{R}^3\text{.}\)
Add x+2y+3z=12 to the plot and you should get a plane. Spin the axes around and zoom in and out with the + and - buttons. You may get something that looks like
Inequalities can also be plotted, however, they are difficult to read. For example, change the \(=\) in the previous plane to a \(\leq\) or \(\geq\) and you will see that half of the \(\mathbb{R}^3\) space is now colored red (in my case). However, adding another inequality will be quite difficult to see the intersecting region.