Chapter 16 Advanced Plotting in Makie
There are a few advanced plotting techniques to discuss. This includes how to create a Plot Recipe to easily plot new objects. In this chapter we will show how to plot the Polynomial object that we created in Section 12.3.
Section 16.1 Creating a Type Recipe for the Polynomial using Makie
Recall that we created a Polynomial in Section 12.3. The following defines the Polynomial
struct Polynomial{T <: Number}
  coeffs::Vector{T}
end
and we will use the following
Base.show to improve the appearance:
Base.show(io::IO, p::Polynomial) = print(io, mapreduce(n -> "$(p.coeffs[n]) x^$(n-1)", (str, term) -> "$str $term", 1:length(p.coeffs)))
And lastly, we’ll make a simple polynomial
p = Polynomial([1,2,3]).
We will also benefit from the
eval method that evaluations the polynomial. This one uses Horner’s method
eval(poly::Polynomial, x::Number) = reduce((val,c) -> x*val+c, reverse(poly.coeffs))
In this section we will make a type recipe which is a way to plot a particular type (usually a user-defined one) using an existing plotting function (line
lines). To determine which Makie function that we will use, the Plottype function is used. For example:
Makie.plottype(::Polynomial) = Makie.Lines
where the only argument of
plottype is the type. Note that since the argument is not explicitly used, we only give the type with :: followed by the type. The plottype is then set to an existing Makie type (note that capitalization).
The conversion of the user-defined type to a type of (in this case) lines is also needed. For this example, we need to take a Polynomial and convert it to a pair of vectors that will be the \(x\)- and \(y\)-points on the curve. The following is a simple way to do this
Makie.convert_arguments(S::Type{<:Lines}, p::Polynomial, domain = -5..5) = Makie.convert_arguments(S, domain, x->eval(p,x))
A few comments about this function.
-
The first argument is the type of the conversion. The argument
Sis aType, we haven’t seen this before and the type must be of typeLines. This is how Makie know when thelinesmethod is called to use this function. -
The second argument is the user-defined type, in this case
Polynomial. Unlike above, the argument needs a name. -
The third argument is called
domainand we give it a default value of theClosedIntervaltype of-5..5. -
The right hand side is the conversion process. The first argument of this is the type,
Sand then the other two arguments are what is passed to thelinesmethod. Although there are a number of ways to do this forlines, since a polynomial is a mathematical function, the easiest way to accomplish this is the plotting domain and a function. The domain is the argument passed in and the function is theeval.
Now with this type recipe in place, we can plot with the following
lines(poly1, -3..3)
and the result is the following plot
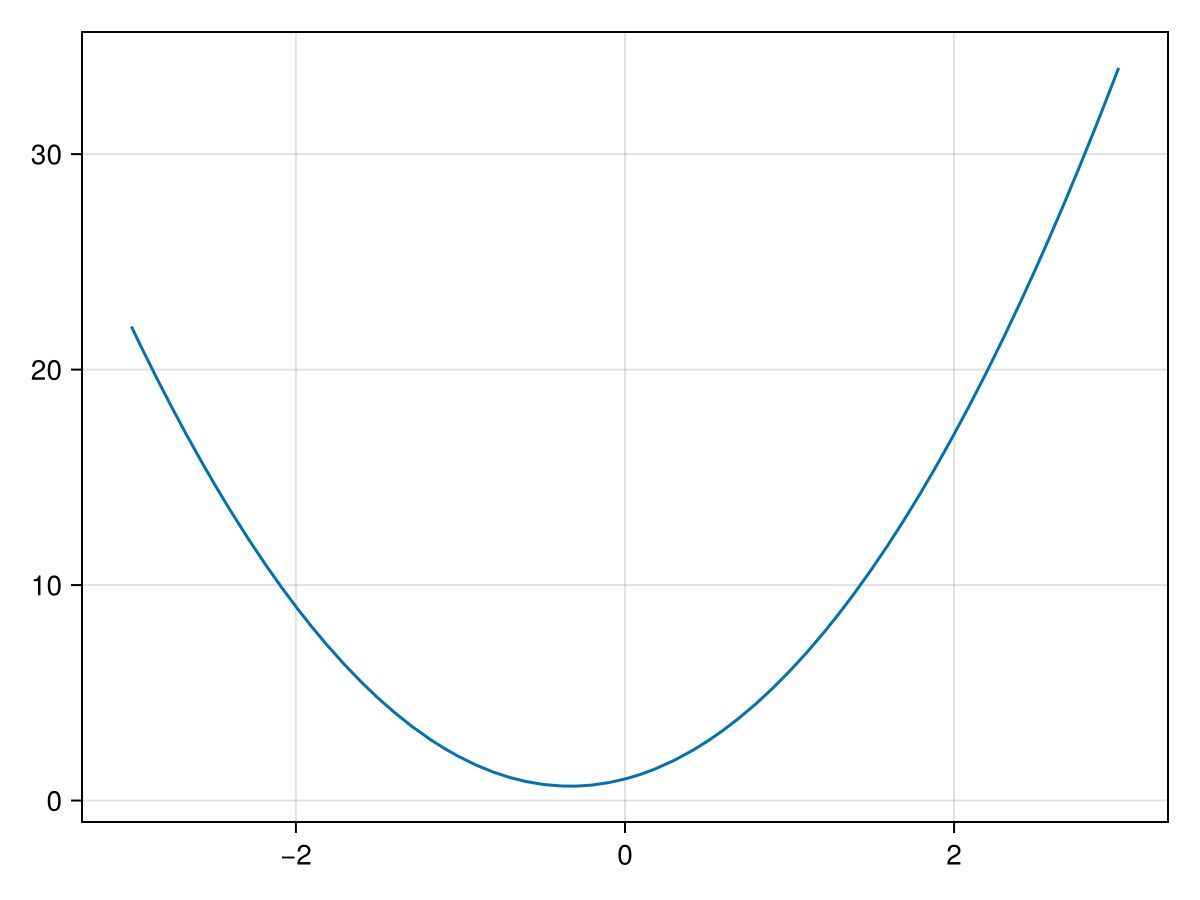
This gives the expected plot of the polynomial on the domain \([-3,3]\text{.}\) Since we added a default plotting domain, if we also can plot with
lines(poly1)
resulting in the following plot
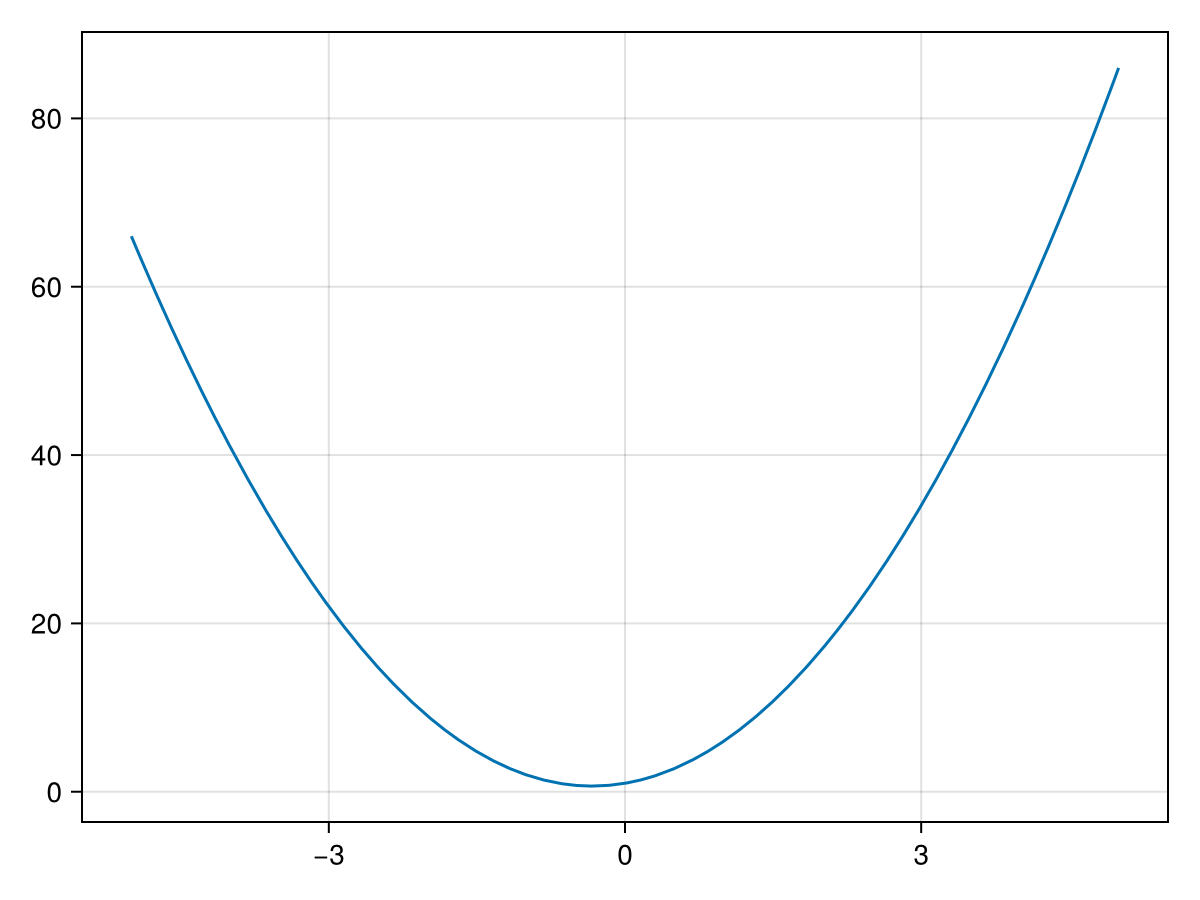
and notice that we didn’t put in the plotting domain, however the default one of
-5..5 was used.
Section 16.2 Another Type Recipe
If we have an object that is a triangle that is defined as 3 tuples like:
struct Triangle{T <: Real}
  pt1::Tuple{T,T}
  pt2::Tuple{T,T}
  pt3::Tuple{T,T}
end
This will create a triangle using 3 tuples (of size 2). There are better ways to do this in general, but this will illustrate another way to build a type recipe. The main problem is that when creating the Triangle, all numbers within the tuples have to be the same type and
We will also use the following
Base.show to help the printed version of the triangle:
Base.show(io::IO, tri::Triangle) = print(io, "Δ[$(tri.pt1), $(tri.pt2), $(tri.pt3)]")
And now we can make a Triangle with
tri = Triangle((0,0),(0,3),(4,0)) as an example. The result is
Δ[(0, 0), (0,3), (4, 0)]
In this section we wish to show how to create a type recipe for a Triangle. First, we need to define the
plottype which will allow Makie to use one it’s existing plotting routines to plot a Triangle. Since we just want a `Line` plot, the following will do this:
Makie.plottype(::Triangle) = Makie.Lines
And like above, we don’t need to give the argument a name (because we never use the name in the function), only the type.
And the other step is to use the
convert_arguments method to take an object of type Triangle and convert them to something that lines understands. Here’s a function that will do this:
function Makie.convert_arguments(S::Type{<:Lines}, tri::Triangle)
  xpts = [tri.pt1[1], tri.pt2[1], tri.pt3[1], tri.pt1[1]]
  ypts = [tri.pt1[2], tri.pt2[2], tri.pt3[2], tri.pt1[2]]
  Makie.convert_arguments(S, xpts, ypts)
end
What this function basically does is create the
x and y points of the triangle and stores them in a Vector. Then the last line passes this to a Lines plot with the two vectors xpts and ypts.
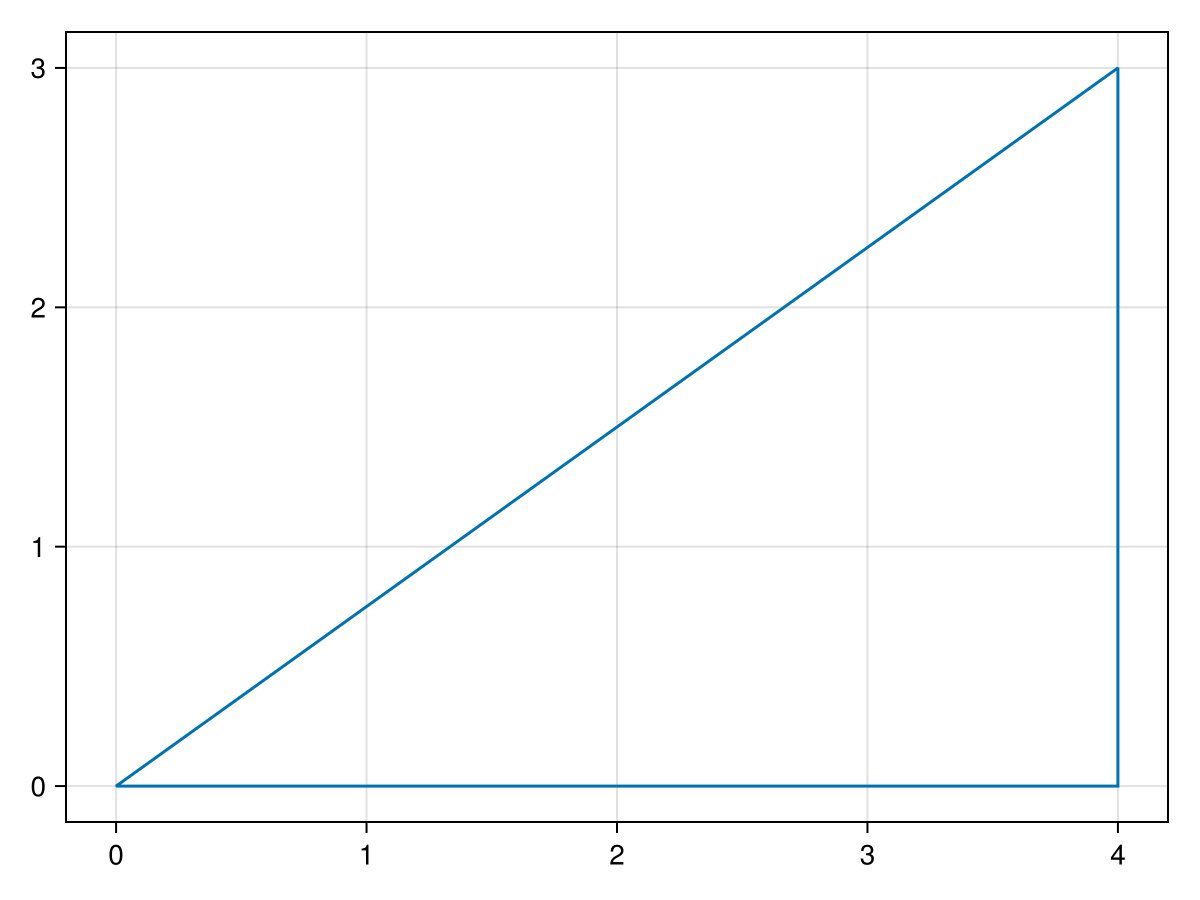
Lastly, let plot the triangle. Since we are using the
lines command for this, we can just do:
lines(tri)
and the result will be the plot
Section 16.3 Plot Recipes
To be finished: explain and show examples of Plot recipes and how they differ from type recipes.
