The data sets for this chapter contain all athletes that have participated in the Olympic games between 1896 and 2016. We use the dataset to answer a number of questions.
What is the total number of medals given in all Olympics in the dataset?
Section39.1Downloading the Data and Loading the Packages
The dataset will be on a site called kaggle.com. More specifically, go to this site and click the download button on the upper right. The download is a zip file and within that there are two files. The one we are interested in is called athlete_events.csv.
where the option missingstring = "NA" is used to replace any NA with the missing value explained in Section 33.2. The first few rows of this DataFrame is:
271116×15 DataFrame            271106 rows omitted
Row  ID     Name                  Sex      Age      Height        Weight         Team            NOC      Games        Year   Season   City       Sport       Event                         Medal
     Int64  String                String1  String3  String3       String31       String          String3  String15     Int64  String7  String31   String31    String                        String7
1    1      A Dijiang             M        24       180           80             China           CHN      1992 Summer  1992   Summer   Barcelona  Basketball  Basketball Men's Basketball   missing
2    2      A Lamusi              M        23       170           60             China           CHN      2012 Summer  2012   Summer   London     Judo        Judo Men's Extra-Lightweight  missing
3    3      Gunnar Nielsen Aaby   M        24       missing       missing        Denmark         DEN      1920 Summer  1920   Summer   Antwerpen  Football    Football Men's Football       missing
4    4      Edgar Lindenau Aabye  M        34       missing       missing        Denmark/Sweden  DEN      1900 Summer  1900   Summer   Paris      Tug-Of-War  Tug-Of-War Men's Tug-Of-War   Gold
Each row of the dataset is each event that has occurred in each Olympics for each athlete that has participated. This will be called an athlete-event in this chapter. Also, note that there are 271,116 rows in this DataFrame. The columns of the dataset are
Subsection39.3.2Collectively taking each summer Olympics, give the top 10 athletes by number of medals
This is a classic split-apply-combine example as shown in Section 36.1. For this, we first drop all rows without a medal and then filter by only Summer games. Since we are asking for the individual medals, we will next group by the athlete ID. This is the first 3 lines within the @chain block and is a good idea to run these lines.
Next, we want to combine the groups. In short, we want the total number of medals (this is simply found by calling nrow) and the name, which is a little trickier. When using combine on a column in a grouped DataFrame, each of the functions that are called take in an array (or an iterator). That is, when extracting Name from the DataFrame, it returns an array of names. The line
Subsection39.3.3List the top 10 countries by medals in only winter Olympics.
To start off, we again filter only by those with medals and in this case the Season column has the value Winter. Then we group by the NOC column, which represents the Country. We then define Total_Medals to be the number within each group. Finally, we order (descending) by Total_Medals and print the first 10 rows.
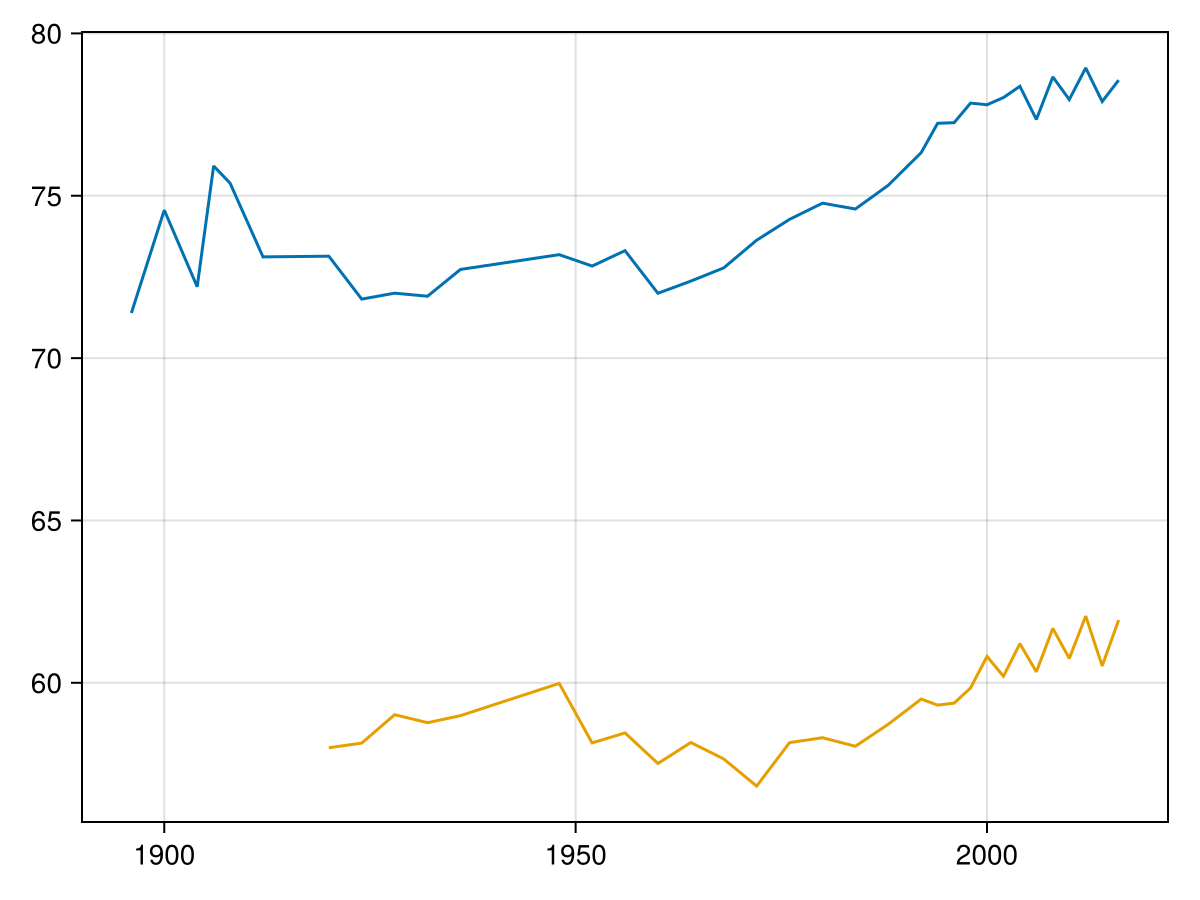
Subsection39.3.4Produce a line plot the average weight for male and female in each year over the entire span of the Olympic games.
In this case, first we’ll drop all rows in which the weight is missing. Then we will group by both sex and year (the year in which the games took place) and then `combine` by finding the mean weight with:
64×3 DataFrame   54 rows omitted
Row   Year   Sex      Mean_weight
      Int64  String1  Float64
1     1896   M        71.3878
2     1900   M        74.557
3     1904   M        72.1973
4     1906   M        75.9171
5     1908   M        75.3861
⋮       ⋮     ⋮          ⋮
60    2012   F        62.0538
61    2014   M        77.9016
62    2014   F        60.5203
63    2016   M        78.5603
64    2016   F        61.9313
It would be nice if we could rearrange the dataframe to make a M(ale) and F(emale) column and then that would be easily plotted. This can be done with the unstack function. Specifically, we can do the following:
Subsection39.3.5Plot the number of medals that the U.S. collected over each olympic year.
First, like above, we will drop rows with missing Medal column and then we filter by the country, using NOC column which is the country code. Since we want the number of medals by year, we group by the Year column and define the num_medals to be the length of the number elements in each group. Finally, we can just plot the results. This can all happen in the same @chain block as follows:
@chain olympics begin
  dropmissing(:Medal)
  subset(:NOC => name -> name .== "USA")
  groupby(:Year)
  combine(nrow => :num_medals)
  barplot(_.Year, _.num_medals)
end
It is interesting to note that this database lists some medals from 1906 1
Suprising to the author, there was an event called the 1906 Intercalated Games in Athens, Greece. This is listed in this database.
Also, it hard not to notice that the 1904 games sent a lot medals to the U.S. 2
The 1904 Olympic games were held in St. Louis, Missouri, which was quite difficult to get to from Europe and other places around the world. This resulted in a large number of American athletes winning medals.
Subsection39.3.6What are the top 5 sports (not events) by total medals given for winter olympics between 1950 and 1970?
Again, like above, since we are looking for total medals, we will drop all rows with a missing value in the Medal column. Then we subset (filter) rows to get winter games between 1950 and 1970. Since we are looking for the top 5 events, we group by Event, total the results then sort
It may seem shocking to see a huge number of ice hockey medals in the timeframe, but since this is a team sport, every member of the team gets the medal. There are generally about 20-25 players on an ice hockey team.
Create a bar plot of percentage male and female participation in the Olympics per year? Start with 1920, the first year that women started competing and use the groupedbar function from the StatsPlots package.
Note that one of the question asked was about the number of medals the U.S. has won in each Olympics and the 1904 games were a bonanza for the United States. How many countries participated in these Games? Determine the number of athletes from each country for this event.